Discover, compare, and save the best monitoring & logging alternatives.
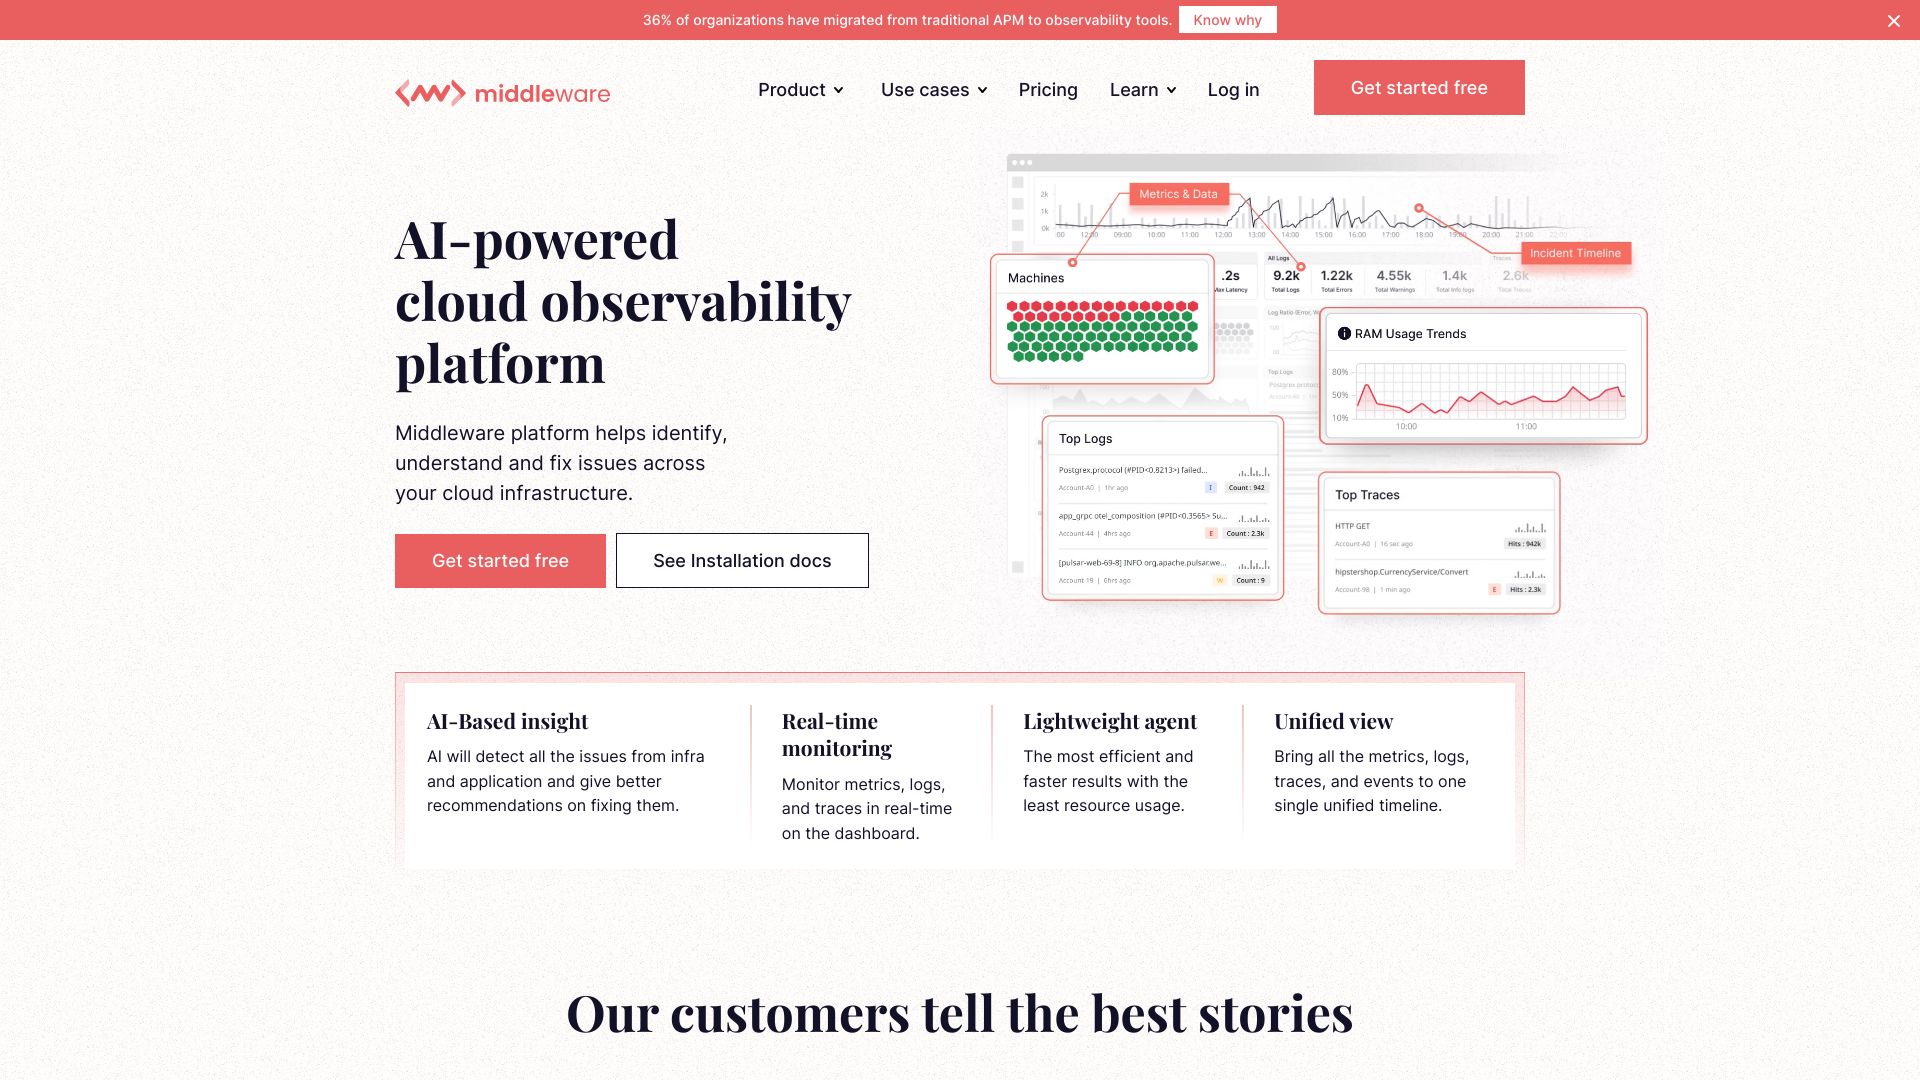
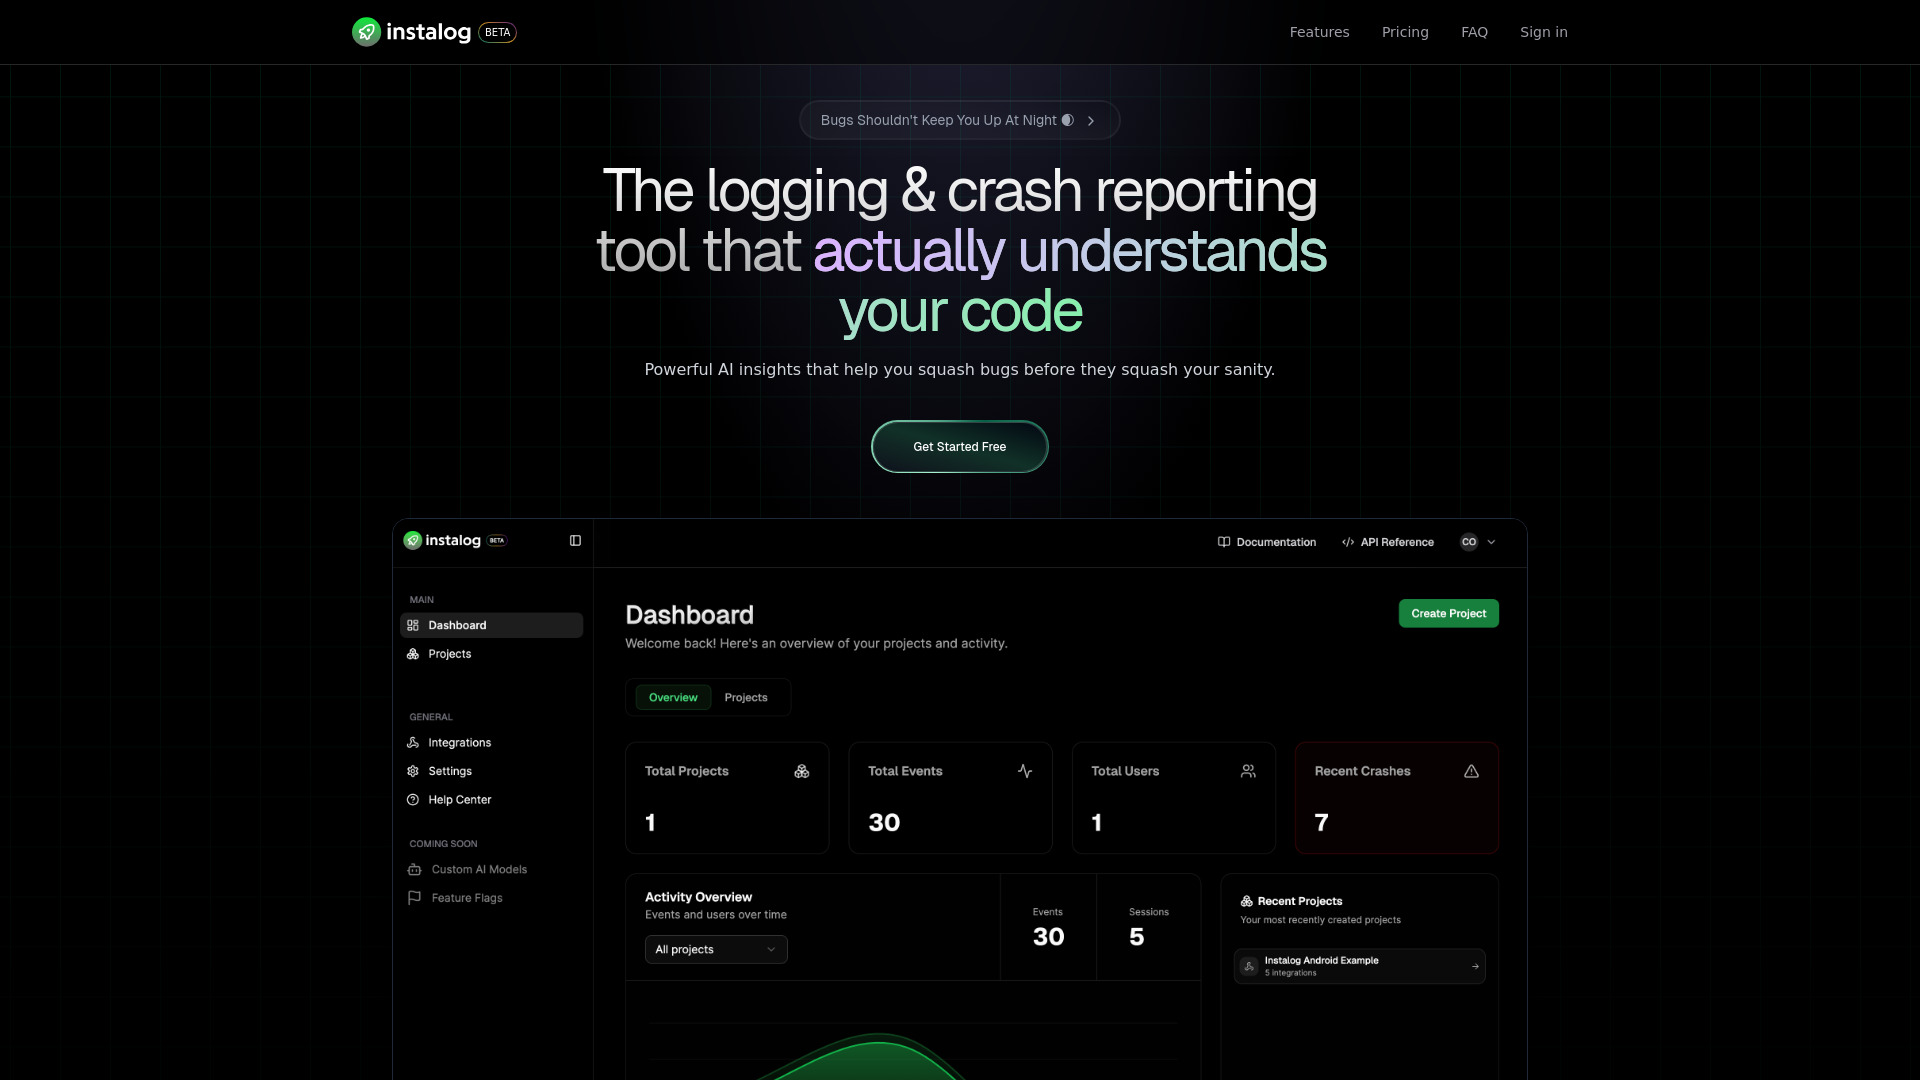
Middleware, Herald, Instalog, Phare, Intel® VTune™ Profiler and Uptrace are among the top-rated Monitoring & Logging picks.
Monitoring & Logging software are essential tools for developers to track and analyze the performance of their applications and systems. These tools suit businesses and individuals who need to identify and resolve issues quickly, ensuring minimal downtime and optimal user experience. By providing real-time insights into system performance, Monitoring & Logging software help solve problems such as slow load times, errors, and crashes. The key differences between Monitoring & Logging options lie in their features, pricing models, and tradeoffs. For instance, some tools like SkyWalking and Telegraf focus on application performance monitoring, while others like GoAccess and Loguru specialize in log analysis. Pricing models also vary, with some tools offering free plans like Gatus, while others like Pingdom and LogicMonitor provide more comprehensive features at a cost. Understanding these differences is crucial to choosing the right tool for your specific needs. To choose the best Monitoring & Logging software, it's essential to evaluate your specific requirements and compare the features, pricing, and user reviews of different tools. Findalternative.net's comparison guide helps narrow down the field by providing a comprehensive overview of top Monitoring & Logging software, including Sentry-javascript and StatusCake, allowing you to make an informed decision and find the perfect alternative for your development needs.
The primary purpose of Monitoring & Logging software is to track and analyze system performance, identifying issues and providing insights to resolve problems quickly and minimize downtime.
Consider your specific needs: if you need to monitor application performance, tools like SkyWalking and Telegraf might be suitable, while log analysis tools like GoAccess and Loguru are better for analyzing log data.
Free tools like Gatus offer a cost-effective way to monitor system performance, ideal for small projects or testing purposes, but may have limitations in terms of features and scalability compared to paid tools.
Yes, many Monitoring & Logging tools, such as Sentry-javascript, provide error tracking and crash reporting features, helping developers identify and resolve issues quickly.
Most Monitoring & Logging tools offer APIs, plugins, or integrations with popular development platforms, making it easy to incorporate them into your existing workflow and start monitoring your system performance.
Cloud-based tools like Pingdom and LogicMonitor offer scalability and ease of use, while self-hosted tools like Telegraf provide more control over data and customization options, but require more maintenance and resources.
Yes, many Monitoring & Logging tools, such as StatusCake, provide features for compliance and security monitoring, helping businesses meet regulatory requirements and protect against security threats.
Monitoring & Logging splits into 11 related categories worth browsing on their own: DevOps & CI/CD (69), API Tools (60), Web Development (58), Low-Code / No-Code (50), Databases (48), and Testing & QA (42) — worth a look if you already know roughly which kind you need.
Browsing by use case instead? These products also surface under Monitoring (29), Open Source (12), DevOps (10), Performance Optimization (6), Analytics (4), and Cloud Native (4) — topic pages that pull from the whole catalog, not just Monitoring & Logging.
Comparing across more than just software? Findalternative.net also covers Hardware, Gadgets, Appliances, Games, and Hosting alternatives.
87% run on Web, 21% on Linux, 15% on Windows, and 13% on Mac — check platform support before committing if you need something specific.
Computed from real platform data across the category.
Across the Monitoring & Logging products in our directory, 71% are free or freemium. 43% of products with a documented drawback cite a learning curve as a tradeoff worth knowing about going in.
Computed from real pricing and pros/cons data across the category — not a review aggregate.