



Middleware
Full-stack observability with an AI SRE agent that detects, diagnoses, and fixes production issues automatically.


What is Middleware?
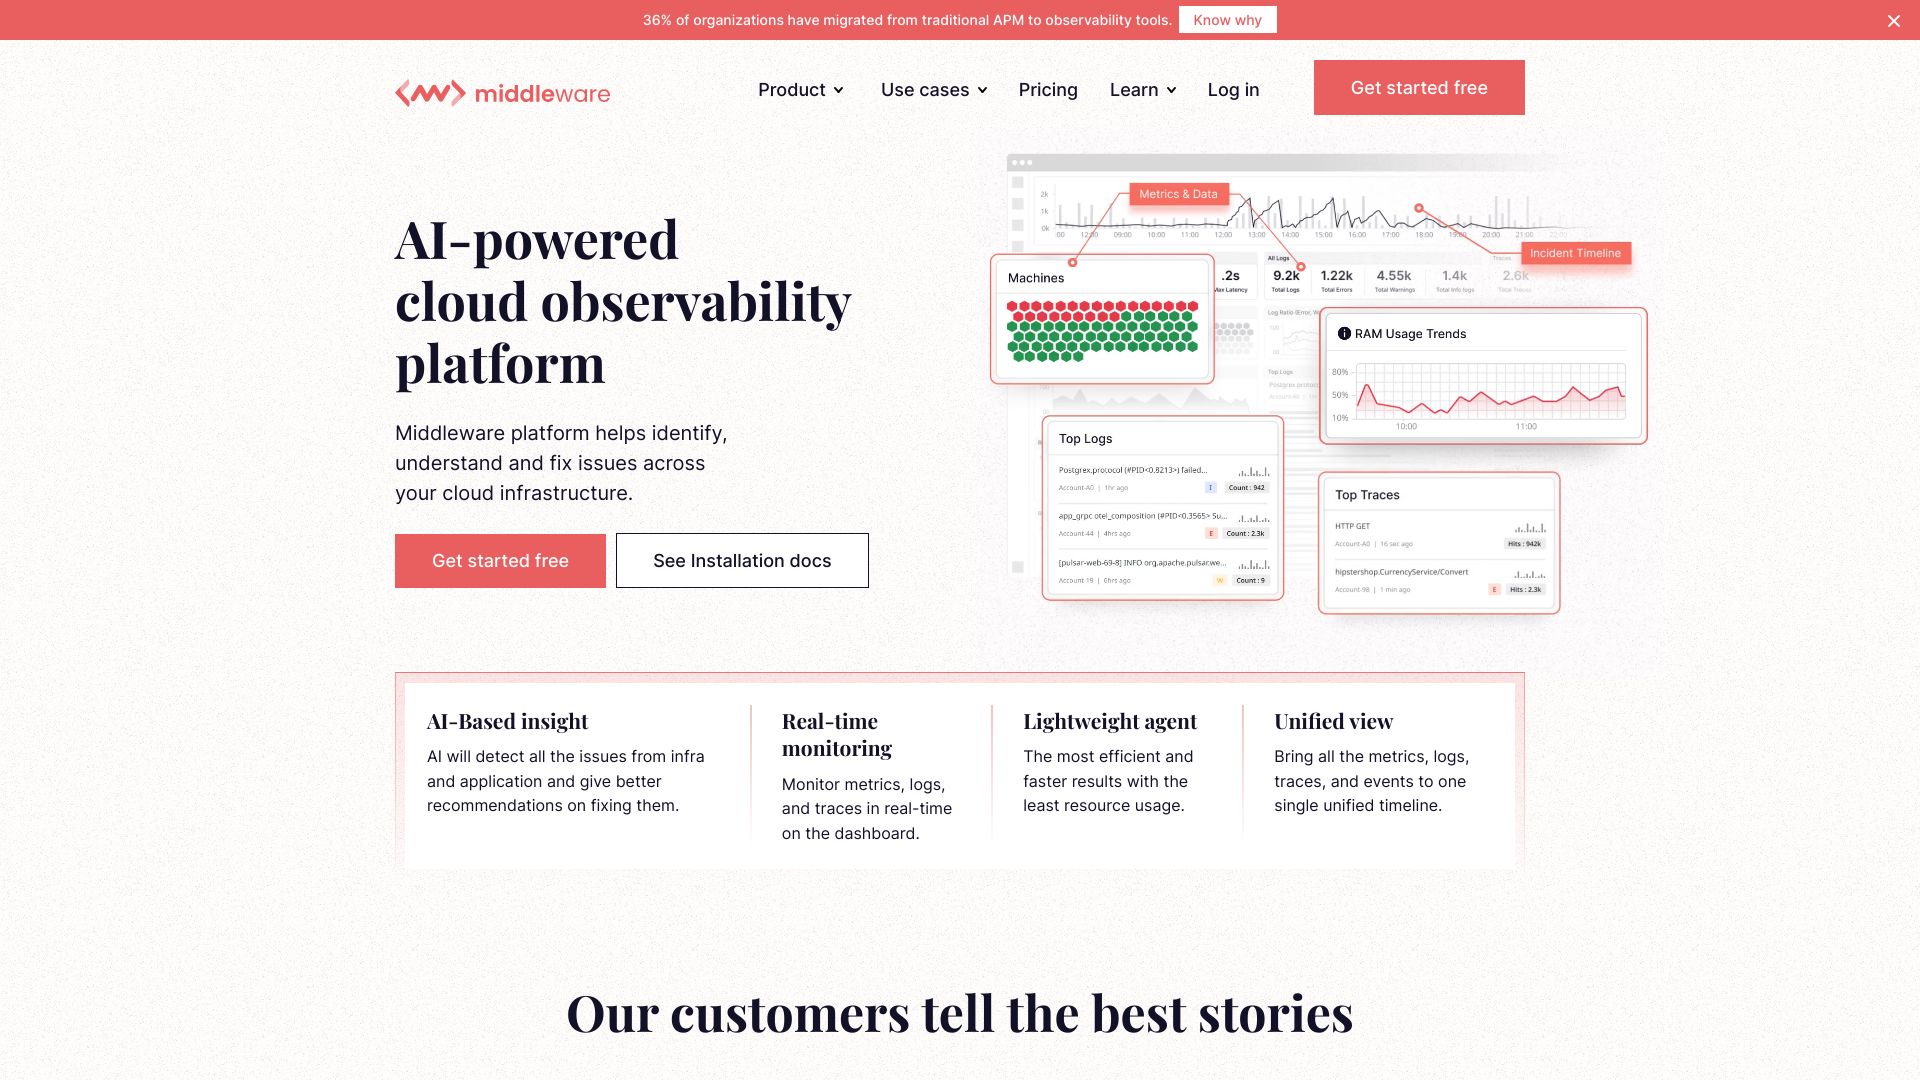
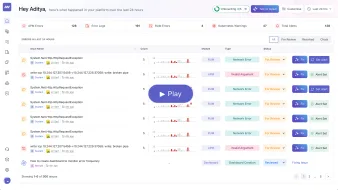
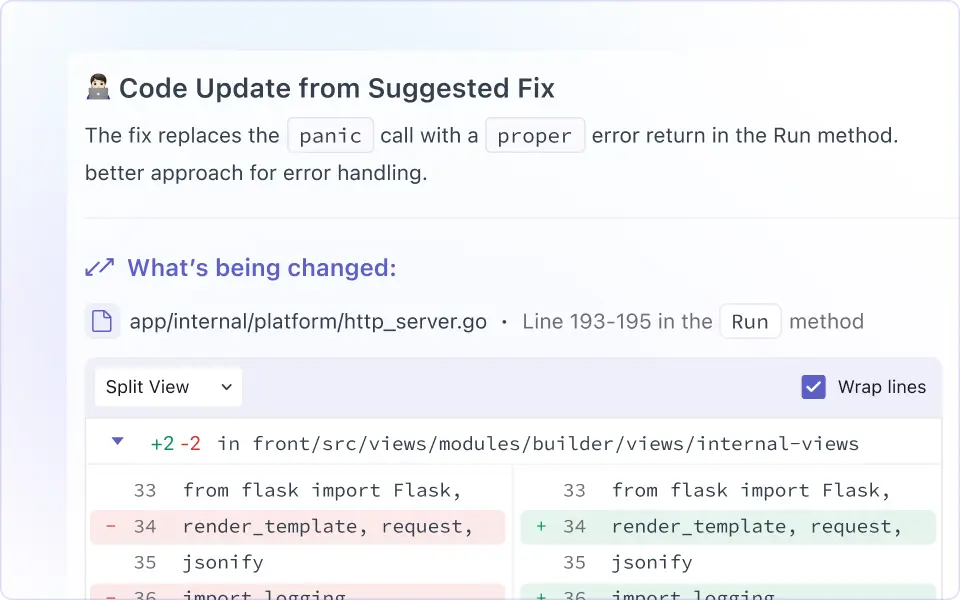
Middleware is a full-stack observability platform that unifies infrastructure monitoring, application performance monitoring (APM), real-user monitoring (RUM), logs, synthetic testing, and LLM observability in one place. Instead of juggling multiple tools, engineering teams can ingest all telemetry data and view it on a single timeline, making it easier to detect issues and move from symptom to root cause quickly. At the core of the platform is OpsAI, an AI-powered SRE agent. It analyzes traces, RUM data, and logs to automatically detect production issues, pinpoint the exact line of code responsible, and even open a pull request with fixes. Users can also ask for dashboards, charts, or queries in plain English, eliminating the need to learn a custom query language. Middleware is built for scale and reliability, with native OpenTelemetry support, 450+ integrations, petabyte-scale data handling, and enterprise-grade security including SOC 2, GDPR, ISO 27001, and HIPAA readiness. It offers a completely free tier to get started and provides 24/7 support from real engineers rather than chatbots.
SpecificationsAI-estimated
Key Features of Middleware
Use Cases for Middleware
Infrastructure Monitoring
Monitor servers, containers, clouds, and other infrastructure components in real time to detect availability and performance issues.
Application Performance Monitoring
Track application traces, latencies, errors, and dependencies to optimize application performance and reliability.
Real User Monitoring
Understand real-user experiences by correlating frontend sessions with backend traces, logs, and metrics.
Log Analytics
Centralize and analyze logs from all services and applications without sampling, enabling faster troubleshooting.
AI-Assisted Incident Resolution
Use OpsAI to automatically detect anomalies, find exact root causes, and even create pull requests with fixes.
Synthetic and Browser Testing
Run synthetic checks and browser tests to proactively verify uptime and user workflows from various locations.
LLM Observability
Monitor LLM applications for performance, cost, and reliability by leveraging Middleware's LLM observability capabilities.
How to use Middleware?
Sign Up and Install the Agent
Create a Middleware account and install the lightweight agent using the one-command installer. The agent can be deployed with manual or auto instrumentation without changing application code.
Configure Integrations
Choose from 450+ built-in integrations to connect your cloud providers, frameworks, languages, and existing monitoring tools.
Explore Unified Telemetry
Once data is flowing, use the unified timeline to view logs, metrics, traces, and RUM sessions together. Signals are automatically linked by trace ID to speed up correlation.
Use OpsAI for Root Cause Analysis
Use OpsAI to automatically detect production issues, investigate root causes, and receive suggested fixes or pull requests. You can also ask plain-English AI prompts to generate dashboards or queries.
Monitor, Alert, and Optimize
Set up alerts and synthetic/browser tests to continuously monitor performance and reliability, then review insights provided by Middleware to prevent future incidents.
Pros & Cons of Middleware
Pros
- One platform for infrastructure monitoring, APM, RUM, logs, synthetic testing, and LLM observability
- OpsAI goes beyond detection by suggesting root-cause fixes and opening pull requests
- OpenTelemetry-native design prevents vendor lock-in
- 450+ integrations and no-sampling telemetry ingestion
- Completely free tier available
Cons
- No transparent pricing details are shared on the website, so estimating costs likely requires contacting sales.
- The AI SRE agent's auto-fix capabilities depend on additional repository and CI/CD integrations and permissions being configured.
- Because it covers so many signals, maximizing the platform's value may require significant setup and tuning for small teams.
Frequently Asked Questions
What is Middleware?
Middleware is a full-stack observability platform that combines infrastructure monitoring, APM, RUM, logs, synthetic testing, browser testing, and LLM observability into a single solution. It uses an AI SRE agent called OpsAI to detect and help resolve production issues automatically.
What is OpsAI?
OpsAI is Middleware's AI SRE agent. It analyzes data from traces, real-user monitoring, and logs to detect production issues, identify the root cause down to the exact line of code, and open a pull request with fixes.
Does Middleware support OpenTelemetry?
Yes. Middleware has native OpenTelemetry support and is designed to avoid vendor lock-in. You can instrument your stack once and keep control of your data.
How many integrations does Middleware support?
Middleware provides 450+ built-in integrations, so most common languages, frameworks, and cloud providers are already supported. You can pick and configure the ones you need out of the box.
Can Middleware handle large volumes of data?
Middleware is built to handle petabytes of telemetry data from day one and ingests logs, metrics, and traces without requiring sampling, so you get complete visibility.
What security and support options are available?
Middleware is SOC 2, GDPR, ISO 27001, and HIPAA ready. It also offers 24/7 real human support from engineers rather than automated chatbots.
Is Middleware free to use?
Yes, Middleware offers a completely free tier with no strings attached, allowing users to solve problems at their source and see the platform in action before upgrading.
Reviews & Ratings0.0
No reviews yet. Be the first to write one!
Top Alternatives & Similar Software
View all alternatives & similar software→

People also viewed



Related searches
Is this your tool?
Claim this page to update details, reply to user reviews, and drive more traffic to your product.
Claim this Product →
Tags
Explore Related Topics
Keep up with Middleware alternatives
New alternatives, pricing changes and the week's biggest movers - one email every Tuesday.