



Datadog vs LogicMonitor
Side-by-side comparison of features, pricing, ratings, and alternatives.
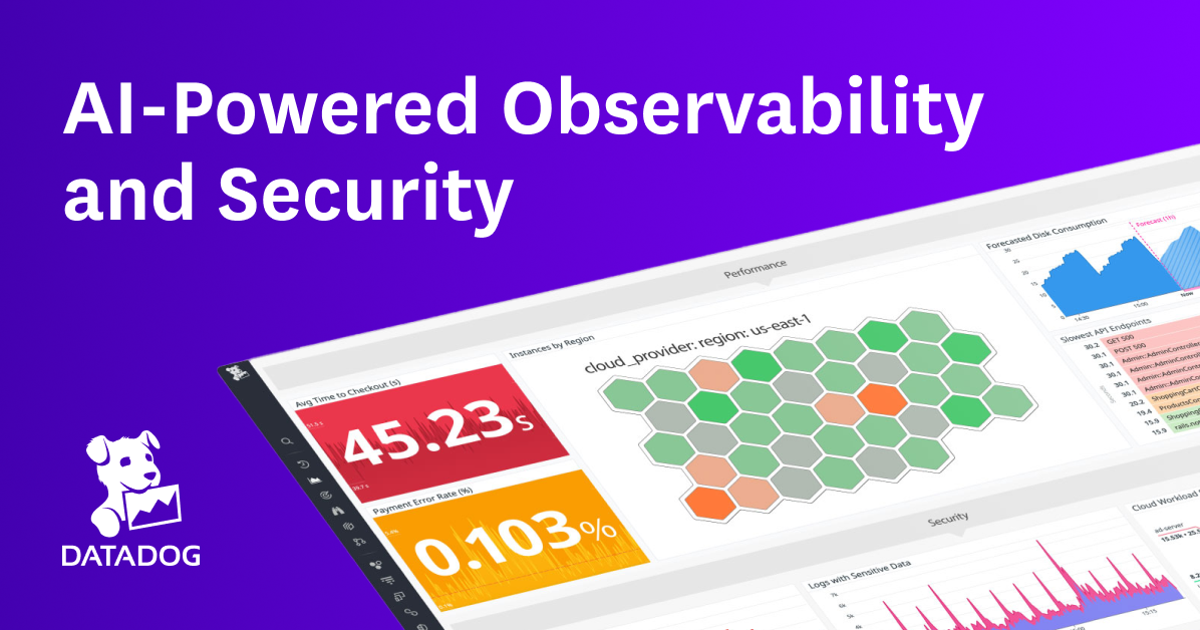

Datadog is a cloud‑based observability platform that provides monitoring of servers, containers, databases, and services. It aggregates metrics, traces, and logs into a single pane. The service offers real‑time dashboards, AI‑driven alerts, and integrations with major cloud providers, helping teams troubleshoot performance issues and ensure reliability.
LogicMonitor delivers a cloud‑native monitoring solution that automatically discovers, maps, and monitors the full stack of infrastructure, applications, and cloud services. Its AI‑driven analytics provide proactive alerts and root‑cause insights, helping enterprises maintain performance and reliability. The platform integrates with major DevOps and ITSM tools, offers customizable dashboards, and supports automated remediation workflows, enabling IT teams to reduce manual effort and accelerate incident resolution.
- Comprehensive integration library
- Unified view of metrics, logs, and traces
- Scalable SaaS architecture with minimal maintenance
- Advanced AI alerts reduce noise
- Zero‑touch auto‑discovery speeds deployment.
- AI‑driven anomaly detection reduces false alerts.
- Extensive out‑of‑the‑box integrations with cloud and ITSM tools.
- Highly customizable dashboards and reporting.
- Pricing can become expensive at scale
- Learning curve for complex dashboard configurations
- Limited on‑premises deployment options
- Pricing can be high for smaller organizations.
- Steep learning curve for advanced configuration.
- Limited on‑premise deployment options.
More alternatives & similar tools
Alternatives to Datadog
View all →



Alternatives to LogicMonitor
View all →

The Verdict
AI-generated from listing dataDatadog offers a broader observability stack (metrics, logs, traces) with a freemium entry, while LogicMonitor focuses on AI‑driven auto‑discovery and infrastructure automation with a paid model.
Key differences
- •Datadog includes native log management and APM; LogicMonitor does not list log or tracing features.
- •LogicMonitor provides zero‑touch auto‑discovery of devices and services, whereas Datadog requires manual integration setup.
- •Pricing model differs: Datadog has a freemium tier; LogicMonitor is only paid subscription.
- •LogicMonitor emphasizes automated remediation via scripts/webhooks; Datadog mentions incident routing but not remediation automation.
Pricing & value
Datadog offers a freemium tier, giving low‑cost entry; LogicMonitor is only paid subscription.
Ease of use / learning curve
Both note a learning curve for advanced configurations; no clear advantage in the provided facts.
Features & depth
Datadog provides metrics, logs, and distributed tracing plus AI alerts; LogicMonitor focuses on infrastructure metrics and auto‑discovery.
Integrations & ecosystem
Both support major cloud providers and Slack; LogicMonitor adds ServiceNow, PagerDuty, Jira, while Datadog adds GitHub.
Collaboration
Both integrate with Slack and incident tools (PagerDuty, email) for team collaboration.
Scalability
Both are cloud/SaaS platforms designed to scale with enterprise workloads.
Support
Both offer 24/7 email, live chat, and phone support.
Choose Datadog if…
Enterprises needing full‑stack observability (metrics, logs, traces) and wanting a low‑cost starter.
Choose LogicMonitor if…
IT operations teams that prioritize auto‑discovery, AI‑driven anomaly detection, and automated remediation.
Common questions
Can I start using Datadog for free?
Yes, Datadog offers a freemium tier; LogicMonitor requires a paid subscription.
Which tool automatically discovers infrastructure without manual setup?
LogicMonitor provides zero‑touch auto‑discovery of devices, services, and cloud resources.
Do both platforms support log management and tracing?
Only Datadog lists native log ingestion and distributed tracing; LogicMonitor does not specify those capabilities.